Informing an Active Transportation Plan with Miovision DataLink
Many cities are exploring ways to improve their transportation networks and, in particular, to extend beyond the vehicle-centric planning which has shaped urban areas for decades.
Such initiatives often seek to encourage and enable two closely related forms of transportation:
- active transportation, which includes walking, jogging, cycling, and skateboarding
- micromobility, which includes electric scooters, docked and dockless shared bikes, other small motorized vehicles, and mobility aids.
McElhanney Assists a City with a Vision
McElhanney provides surveying, engineering, GIS and remote sensing, community planning, landscape architecture and environmental services—primarily across Western Canada.
In 2019, McElhanney won a tender process to conduct a two-phased traffic study for one of Canada’s 20 largest population centers:
- An initial phase in 2019 to cover a broad set of active transportation corridors
- A second phase in 2020 to focus more deeply on a smaller subset of corridors
Already with more than a quarter-million residents, population forecasts suggest that the city will grow to more than half a million people in the next 30 to 40 years.
In planning for the future, the city wanted to ensure balanced growth while providing transportation alternatives and creating locations which bring people together. Ultimately, the city’s goal is to create a healthier, more integrated, more accessible and more attractive environment.
The city’s vision includes many strategies in pursuit of this goal, including adopting an integrated approach to growth related to transportation, servicing, transit and land use.
The city’s previous investments in infrastructure and new modes of transportation had already begun to shift attitudes about the most effective, efficient and sustainable ways to move around, and the transportation network already included a public transit system and a network of bike routes.
Looking ahead, in the next 10 years the city aims to more extensively develop an integrated transportation network that is practical for a mix of transportation modes—including vehicles, buses, bicycles, pedestrians.
As part of executing on this vision, the city created an Active Transportation Plan (ATP) focused specifically on human-powered transportation, including walking, jogging, cycling, skateboarding, cross-country skiing, as well as micromobility devices—electric scooters, docked and dockless shared bikes, other small motorized vehicles, and mobility aids.

Practically, the ATP also includes a detailed implementation plan and monitoring strategy with short-, medium- and long-term priorities for improvements to walking, cycling and other forms of active transportation throughout the city.
As part of the ATP, the city conducted a survey of residents to understand demand for active transportation and related factors. This survey provided the city with a number of important insights, including:
- Nearly half of the city’s residents want to walk or cycle more:
importantly, residents use walking and cycling both for purposeful and recreational reasons - Residents are walking and cycling throughout the year:
when snow isn’t a factor, more than 90 percent of residents walk and 50 percent cycle for commuting to work or school, running errands or for recreational and leisure; during snow months, the number of walking and cycling trips decreases - Residents highlighted practical barriers to walking:
residents noted that completing sidewalk networks and improving intersection crossings would help to reduce barriers - Residents don’t like cycling on busy streets without safe bicycle infrastructure:
residents noted the importance of developing a network with protected bike lanes and of improving winter clearance
These insights helped to shape the overall ATP and provided input into subsequent steps.
The Demand for Real Data
While telephone and online surveys are useful tools for engaging with the public and gaining general qualitative insights, they are not substitutes for the hard data needed to direct specific investments and actions effectively and efficiently.
Recognizing this reality, the ATP called for the city to conduct multimodal traffic studies and analysis—and this is where McElhanney and Miovision entered the picture.
Executing a Benchmarking Program
Making sure taxpayer funds are put to the most effective use required fulfilling the ATP’s needs in the most efficient manner possible. To meet these obligations, McElhanney carefully designed their winning Active Transportation Benchmarking Program.
Selecting Data Collection Locations
While the city provided McElhanney with general areas where data was needed, it was left to McElhanney to decide on the precise collection locations.
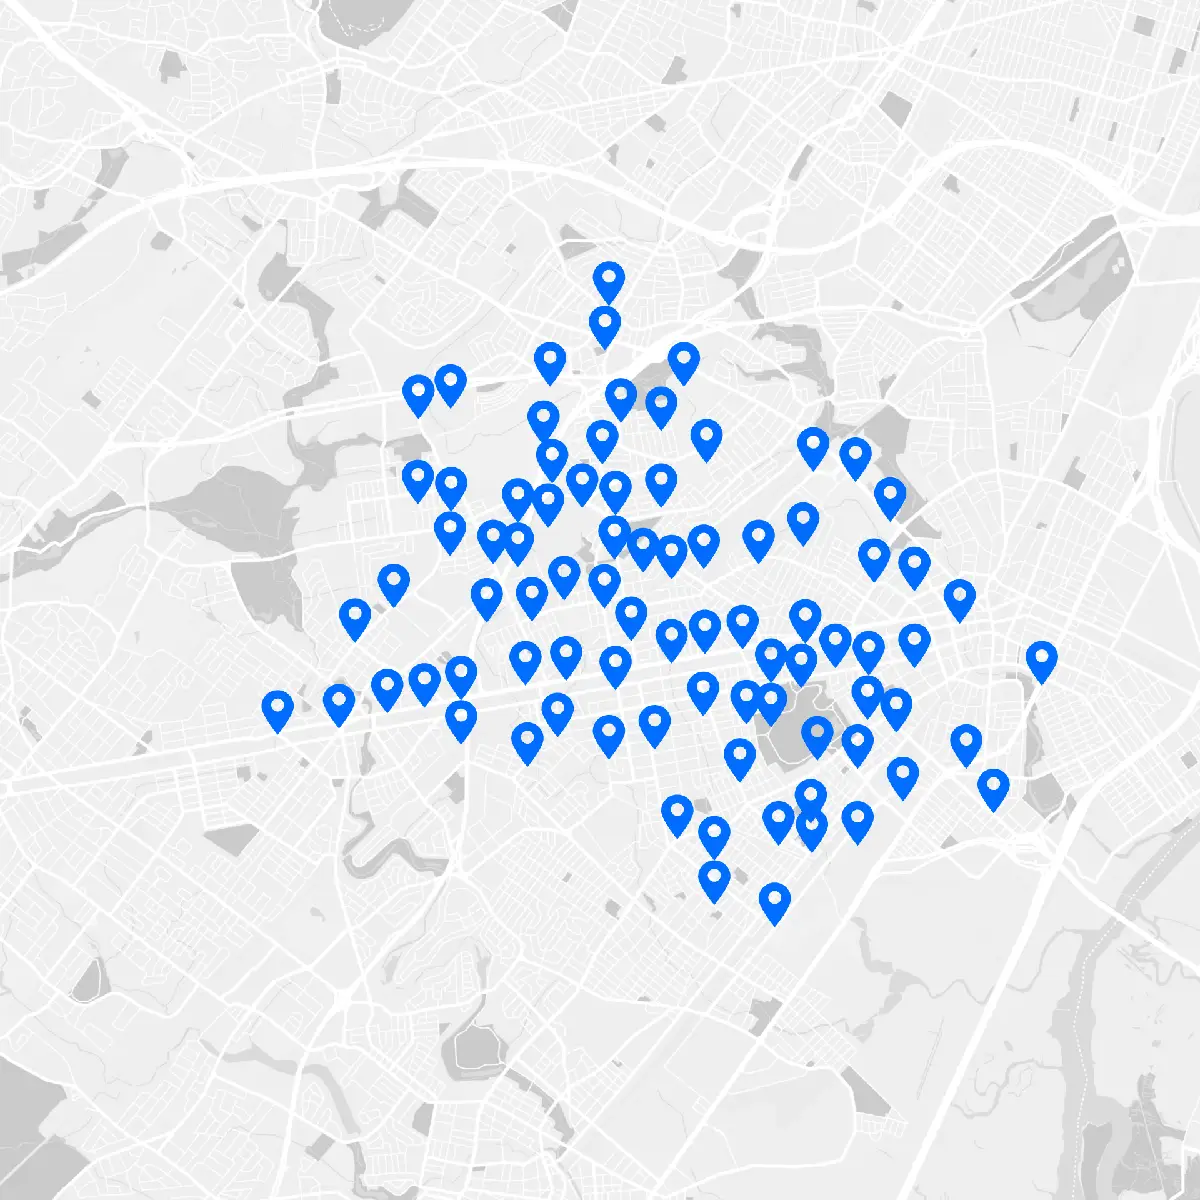
The first phase of data collection covered 82 sites (Figure 1). This significant undertaking included multi-use pathways (MUPs), pedestrian over- and under-passes, sidewalks and bike lanes. The dual goals of this phase were to gather broad baseline data and to inform the selection of the locations to be included in the secondary phase.
McElhanney provided the city with a list of the proposed sites and reviewed them with the project planners in case there were any concerns.

The major constraints on a collection activity of this magnitude are timing and equipment:
- There’s a fairly narrow calendar window in which the baseline data can be gathered and each of the sites needs a long enough collection period to deliver reliable data
- Covering so many sites requires a lot of equipment
Scheduling Data Collection
To ensure the ATP properly accounts for commuter traffic, data collection focused on weekdays, using a 3-day schedule. Since infrastructure is designed around accommodating peak demand, limiting the collection to weekdays provided the data the ATP needed. Plus, this focus also kept costs lower for taxpayers, as a 7-day collection period would require more resourcing.
To create a consistent and reliable baseline, McElhanney followed the same collection plan at each location:
- Monday: deploy the Miovision Scout units
- Tuesday through Thursday: data collection
- Friday: retrieve the Miovision Scout units
For this project, McElhanney implemented a collection plan which rotated 20 Miovision Scout Video Collection units by breaking up the target sites into different regions and collecting data in a different region each week.
- Week 1: 12
- Week 2: 17
- Week 3: 16
- Week 4: 12
- Week 5: 19
- Week 6: 6
- Week 7: Contingency
McElhanney’s collection period spanned seven weeks in September and October 2019 and included a contingency week to account for unexpected delays like the impact of adverse weather conditions
Importantly, McElhanney reviewed the details with the city and made sure to plan around special events (which would distort the baseline). The inclusion of a contingency week provided a buffer in case the collection period was impacted by adverse weather or an unforeseen event like an emergency.
Installing and Removing Equipment
McElhanney relies upon Miovision’s Scout VCUs and Connect devices to collect transportation information. In addition to the 20 VCUs reserved for data collection, McElhanney had additional Scout units available if needed to accommodate schedule changes.
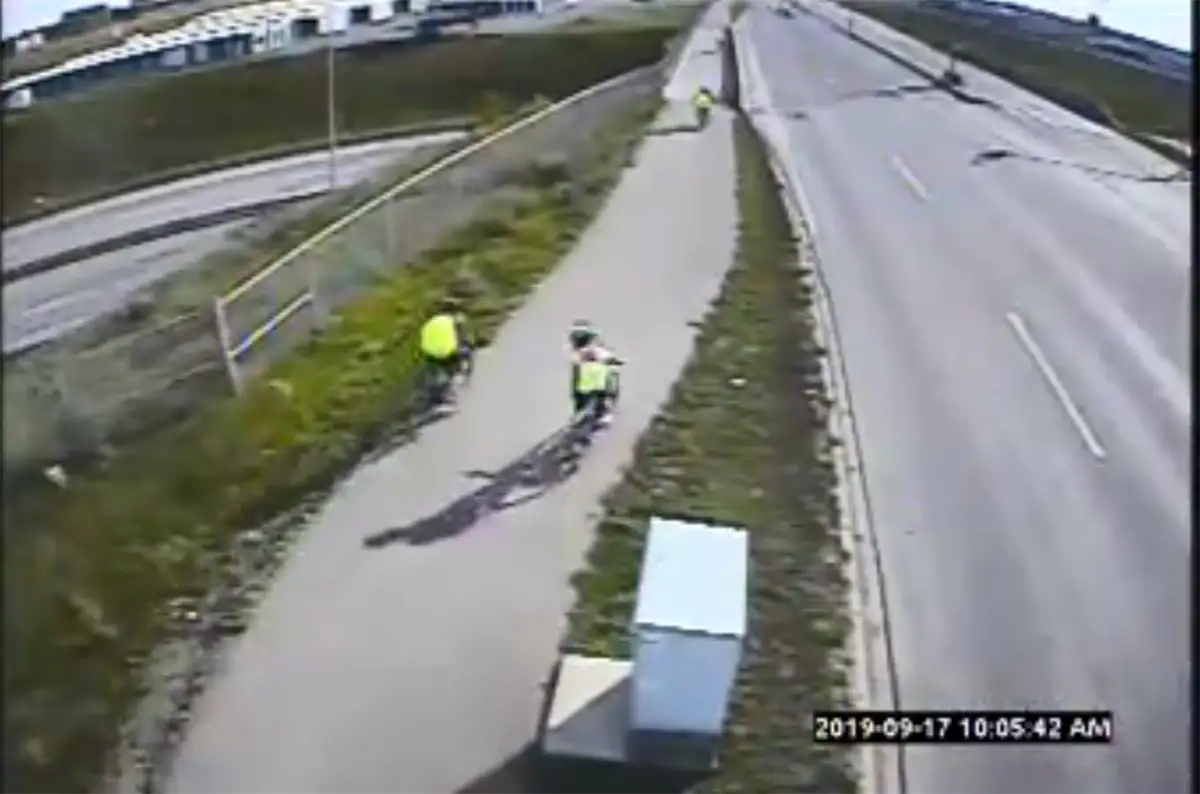
Miovision’s Scout VCU’s provide the industry’s most accurate and efficient option for pedestrian and cyclist data collection (Table 2). The pedestrian pathway processing function allows users to deploy a single unit and capture information in up to four directions, which is ideal for the multi-use pathway intersections which made up many of the collection locations.
Superior and Auditable Multimodal Accuracy
- Data is collected properly the first time; very few recounts are required
- Video can be reviewed and verified to ensure accuracy
- Pedestrian and cyclist behavior is observable as a complement to raw data
Safer Setup and Teardown
- Scout setup is done at the roadside/trailside, rather than in the roadway/trailway, eliminating the need to install during gaps in traffic
Operational Efficiency
- Scout deployment requires only one person
- Deploying the Scout is fast and simple
- Retrieving the Scout takes even less time
The Miovision Connect devices allowed McElhanney to log in to the VCUs remotely to check the camera feed, reducing the need for costly and time-consuming field visits.
Following a Proven Process
To ensure proper installation and removal of the collection equipment, McElhanney relies on Field Reports, which include detailed instructions and checklists. The general installation procedure is:
- Perform a desktop site investigation (using Google Street View) to determine deployment location and equipment requirements
- Load equipment into the field vehicle, ensuring equipment numbers match and that all items needed for the VCU are included; check batteries, SD cards, etc.
- Complete safety checks and documentation
- Travel to data collection location
- Investigate the deployment area to ensure practicality and safety (check for overhead lines)
- Deploy the Miovision Scout VCU, and tripod if required, following the Miovision guidelines
- Setup the Scout VCU’s schedule to record, check the battery power and available storage on the SD cards and then complete documentation of these checks
- Secure all equipment with lock and chain; take a picture of the finished installation
- Ensure nothing is left behind before leaving
- Monitor the unit throughout the week during recording via the Scout Connect remote functionality in the DataLink Platform
Removing the equipment simply followed the steps in reverse.
Communicating Clearly
It is important to provide clear communication when engaging in data collection, as members of the public can raise safety or privacy concerns when they encounter data collection equipment for the first time.
For this reason, McElhanney has established guidelines to help with clarity and transparency:
McElhanney provided the city with:
- An FAQ made specifically to address citizen concerns
- Provide a schedule with current weeks locations and communicate changes to the City
McElhanney provided training to the field technicians who are deploying the equipment as to the proper methods of interacting with the community when deploying equipment. This includes:
- Directing communications towards the city’s designated contact
- Acting in a kind and civil manner to members of the public and to be respectful of their surroundings
- How to interact with members of the public who are curious about the technology
Throughout the entire process, McElhanney closely coordinated with the city to ensure the collection program was a success. For its part, the city also took steps to proactively build support and ensure transparency:
- The city posted the FAQ library on its citizen portal
- The city proactively communicated with the local university to let them know about the collection program and to provide an opportunity for the university and its stakeholders to ask questions
Processing the Data
Upon completion of the collection period, the video from the Scout units was uploaded to Miovision’s servers and processed. 72 hours of video was processed, focusing on weekdays:
- Start time: Tuesday at Midnight (00:00)
- End time: Friday at Midnight (00:00)
This processing automatically classifies pedestrians and cyclists in two directions and provides the accurate data foundation needed to inform a successful and efficient Active Transportation Plan.

Delivering Output
Over the collection period, McElhanney’s Scout units had collected more than 6,000 hours of real-world traffic video, which Miovision turned into precise multimodal usage data.
McElhanney’s traffic engineers analyzed this data and provided a comprehensive report to the city to reveal the findings and to recommend which subset of locations should be covered by Phase 2 of the benchmarking program. McElhanney supported this report with GIS-ready files and MS Access-ready files tailored to the city’s database requirements.

