Key Takeaways
- The most dangerous time to drive is often between 3 p.m. and 7 p.m. on weekdays and late at night on weekends.
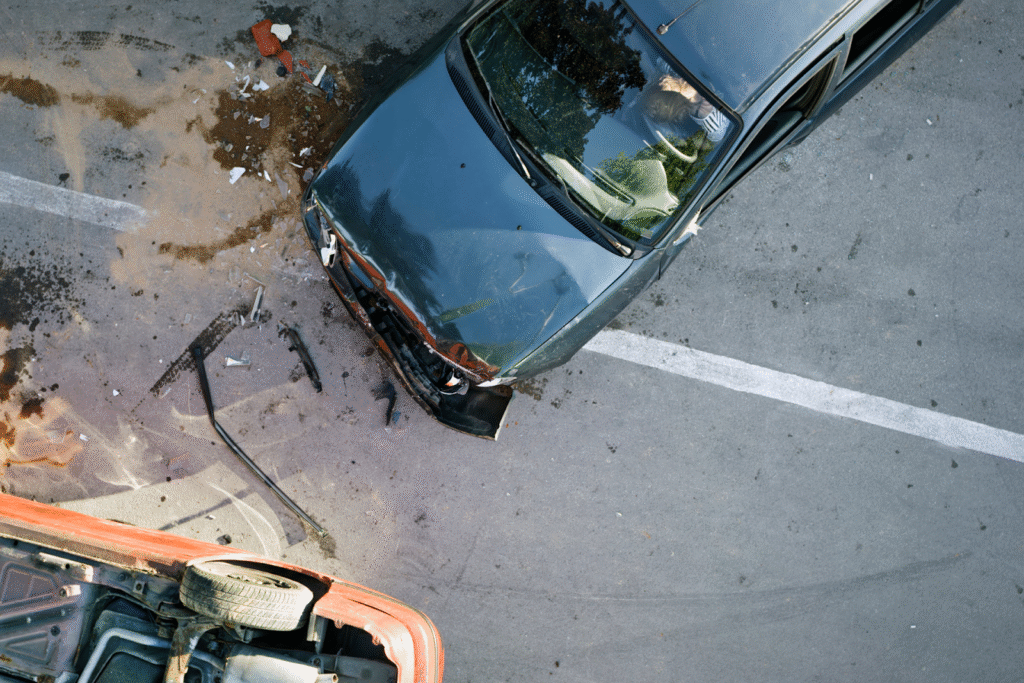
- Intersection crashes make up a significant share of urban accidents, especially in signalized intersections.
- Seasonal changes in weather and daylight have a profound impact on road safety.
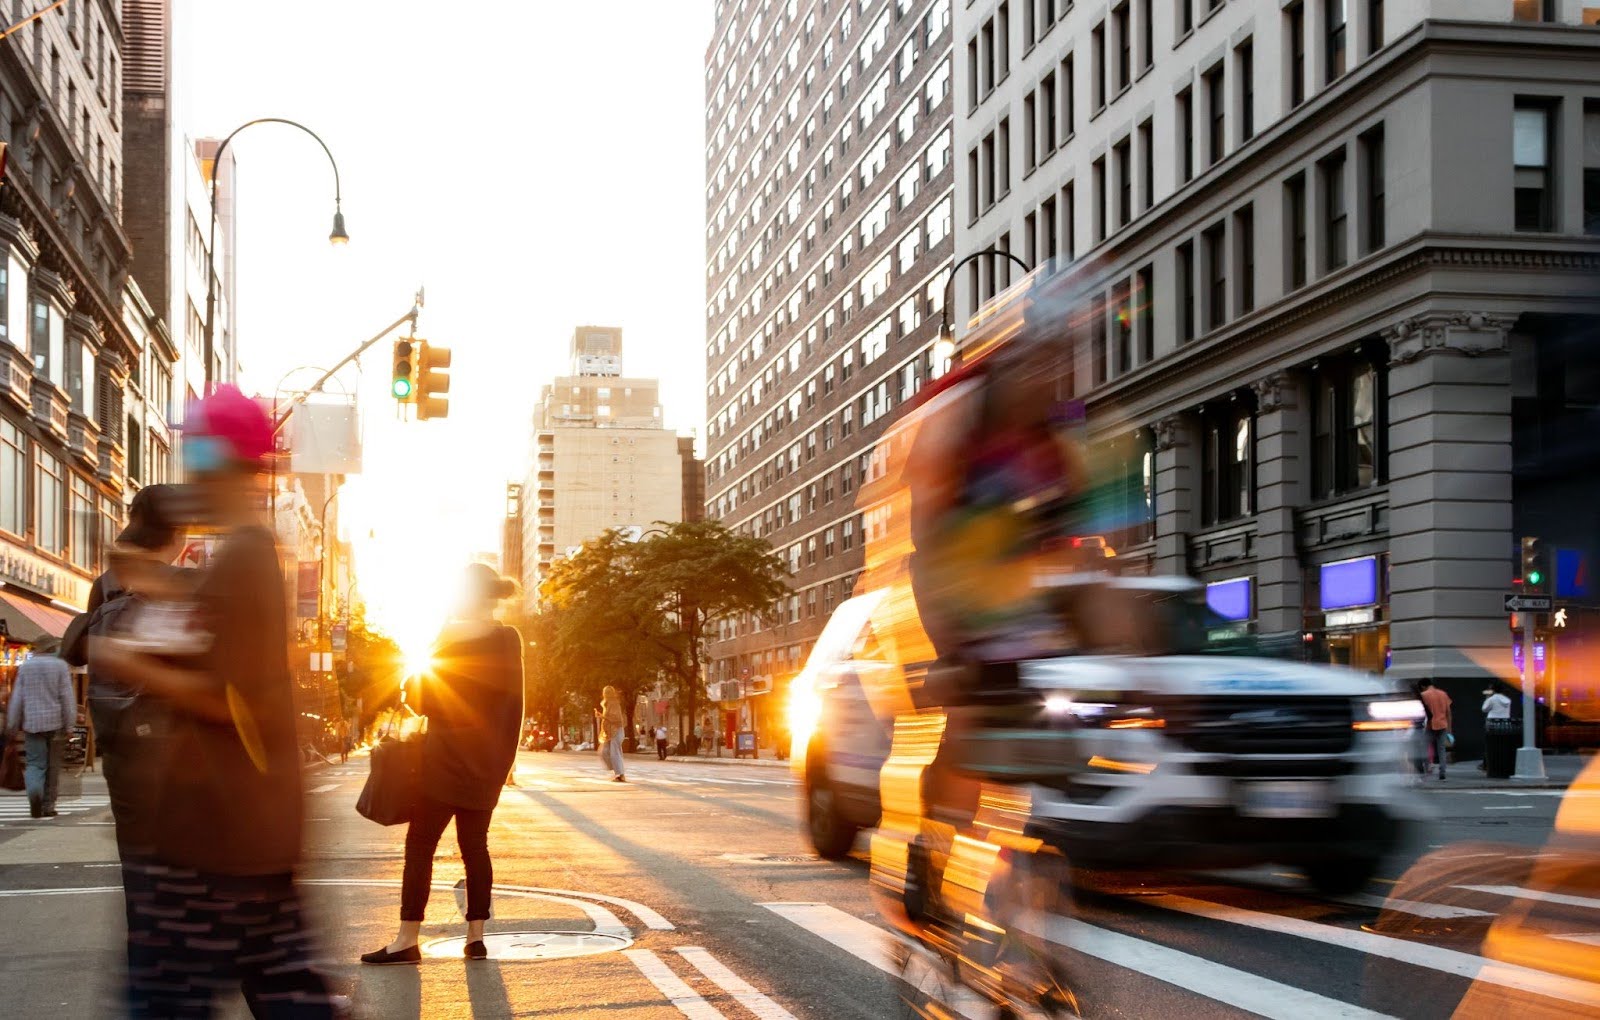
When’s the most dangerous time to drive? Some hours and days are riskier for drivers and pedestrians. Peak traffic times see more accidents due to congestion and rushed driving. Knowing these trends helps drivers stay alert and take precautions during risky times.
Whether it’s a bustling weekday rush hour or a late-night weekend cruise, timing can significantly influence the likelihood of a collision. Driving during peak times may be inevitable. With data-driven insights and advanced technology, urban planners and safety advocates can transition from reactive measures to proactive strategies.
This approach focuses on enhancing intersection safety, saving lives, and reducing public costs related to emergency services and vehicle damage, all while fostering safer streets. Here’s what the NSC data tells us:
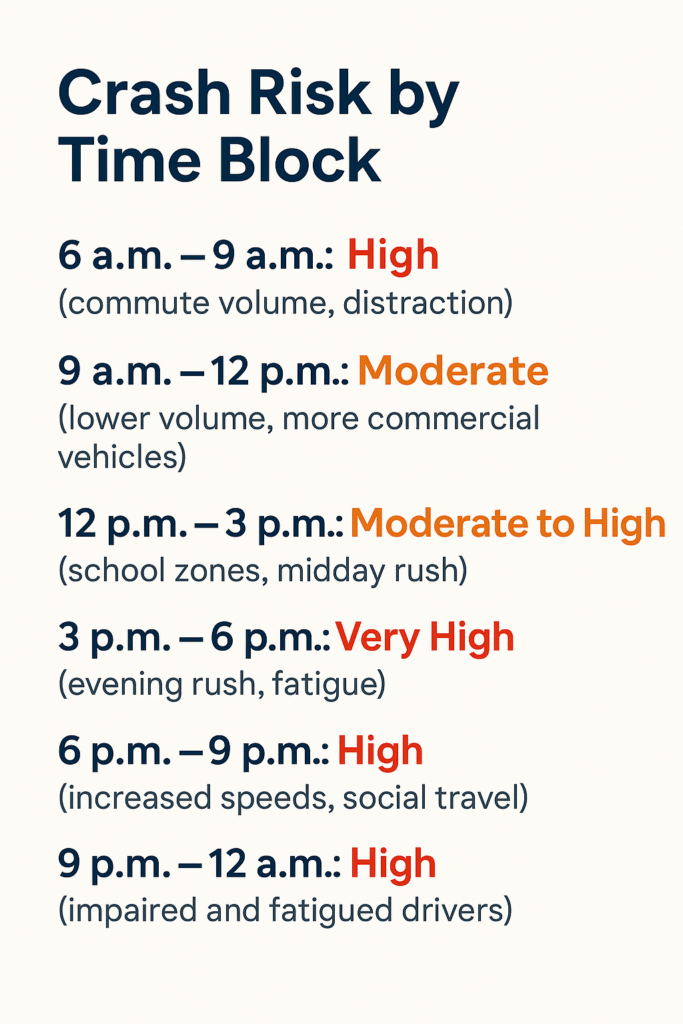
- Weekday peak risk: 3 p.m. to 7 p.m. due to congestion, fatigue, and aggressive driving
- Weekend peak risk: 6 p.m. to midnight, driven by impaired or recreational driving
- Red light violations and distracted driving increase during these periods.
In this post, we’ll explore key time-based patterns and what they mean for your city’s road safety strategy.
The Most Dangerous Hours at Intersections
Timing is everything when it comes to intersection safety. According to Notraffic and NSC, the riskiest hours for crashes are typically weekday mornings and early evenings—essentially, rush hour. These are times when congestion, fatigue, and distraction all peak. Weekend evenings, particularly between 6 p.m. and midnight, also see a spike in impaired or high-speed, aggressive driving resulting in crashes.
The timeframes noted above also involve a mix of vehicle types—school buses, delivery trucks, commuters, and service vehicles—all navigating the same corridors. Combined with limited reaction time at complex intersections, this makes even minor errors potentially catastrophic.
Miovision’s technology, like Core and automated data collection for traffic solutions, enables cities to collect their own localized, real-time analytics, allowing them to deploy signal timing, signage, and enforcement tactics precisely where and when needed.
Weekday vs Weekend Crash Patterns
Is driving more dangerous on weekends than weekdays? Yes, though weekdays tend to have higher traffic volumes due to commuting patterns, weekends pose distinct risks, with Saturday (night) being cited as the most dangerous day to drive, and the worst for traffic fatalities.
What makes weekends riskier for intersection crashes?
Key factors include:
- Increased alcohol consumption, especially in the evenings
- Less predictable traffic patterns compared to weekday routines
- Higher speeds due to more open roads and reduced congestion
Do specific times on weekends carry more risk?
Evening hours—between 6 p.m. and midnight—are particularly high-risk on weekends. This is when social events, nightlife, impaired or distracted driving and reduced visibility combine to elevate crash likelihood. In these cases, serious injuries and death often occur. The most fatal accidents tend to occur on Saturday night and into the early hours of Sunday mornings.
Are certain groups more at risk on weekends?
Yes. Younger drivers are more inexperienced, vulnerable road users, are more active during weekends, and statistically more likely to engage in risky behaviors, such as speeding or distracted driving. Pedestrians and cyclists are more vulnerable during recreational hours, as drivers may prioritize less pedestrian safety when foot traffic is low.
Why does behavior change so much from weekends and weekdays?
During the week, driving is often goal-oriented: work, school, errands. On weekends, leisure travel tends to dominate, leading to more relaxed attitudes toward traffic laws, longer trips, and unfamiliar routes. These behavioral shifts influence intersection safety.
Seasonal & Weather Impact
Winter months introduce poor visibility, icy roads, and slower reaction times. Rain and fog during spring and fall can also increase the likelihood of an intersection crash. In summer, glare and increased road usage contribute to the risk.
Extreme weather, combined with certain times of day, can exponentially increase crash likelihood. For example, a dark, rainy rush hour creates layers of danger. Snowy intersections with worn or obscured lane markings become hot spots for confusion, while glare from summer sunsets can reduce visibility at peak times. Even mild weather events, such as drizzle, can increase stopping distances and reduce tire traction.
Intersections vs Midblock Incidents
While intersections in residential areas represent only a portion of the roadway, they account for disproportionate accidents. The FHWA notes that over 50% of serious traffic injuries and fatalities happen at or near intersections.
Mid-block crashes are often linked to speeding and road design, but signalized intersections introduce complex risks, including:
- Red light running
- Sudden lane changes
- Pedestrian conflicts
Unlike mid-block segments, intersections concentrate multiple decision points into a small area—turning, stopping, accelerating, and yielding all occur in rapid succession. This complexity poses a significant threat to pedestrians and cyclists, forcing them to contend with unpredictable vehicle movements.
How Smart Traffic Technology Can Reduce Risk
Miovision’s smart traffic solutions help municipalities respond to intersection safety trends with:
- Signal optimization to manage high-volume hours
- Vision-based sensors to detect near-misses and risky behavior in real time
- Automated traffic data analytics to track patterns and inform strategy
Using AI-driven insights and data collection, cities can proactively prevent collisions and reduce the risk of fatal crashes before they occur.
Real World Evidence
In a multi-city deployment across 50 intersections in five Canadian municipalities, Miovision’s Safety Studies identified high-conflict zones and helped implement targeted safety countermeasures.
The result? An average 85% reduction in conflict risk, demonstrating how data-driven interventions can dramatically improve intersection safety.
During this multi-city study, Vancouver used video data from Miovision Scout cameras (at multiple locations) to identify and address risk factors for cyclists. The result was a 54.8% reduction in near-miss incidents and a 68% increase in cycling volumes.
Download the full case study here.
Driving is part of life. Some days and times are riskier for drivers and pedestrians, but data-driven intersection safety technology can help prevent crashes before they happen.
Smart traffic tech is crucial in turning intersection safety trends into actionable solutions.
Want to know when your city’s intersections are most at risk, prioritize traffic safety, and learn how to improve intersection safety? Contact Miovision to turn safety data into smarter action.