View All
33%
increase in bicycle ridership after bike lane implementation
87%
bike lane utilization rate, indicating strong cyclist adoption
31%
of vehicle–bicycle conflicts identified as right-hook movements (critical insight uncovered via near-miss data)
24/7
multimodal safety monitoring at key downtown intersections

The Challenge: High-Stress Conditions for Cyclists

An engineering evaluation revealed that traffic conditions along a major Bellingham corridor created high stress and safety risks for bicyclists—particularly less experienced riders—despite significant bicycle traffic. These conditions exposed a critical gap in the city’s active transportation network and underscored the need for a safer, data-informed bike lane design.


Key Pain Points:

  • High-stress conditions for cyclists along a major downtown corridor
  • No dedicated bike infrastructure despite 400+ cyclists per day using Holly Street
  • Limited visibility into near-miss conflicts and turning behaviors
  • Community concerns about safety, visibility, and congestion


The Approach: Using Data to Identify Risk and Measure Impact

To address these challenges, the City of Bellingham deployed Miovision Scout Plus® and Continuous Safety Monitoring (CSM) to better understand how vehicles, cyclists, and pedestrians interacted along the corridor.


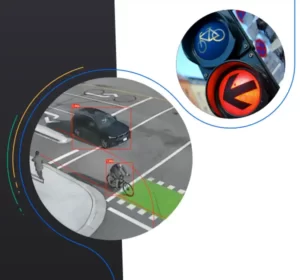
By leveraging turning movement counts (TMCs), near-miss analysis, and conflict video clips, the city was able to proactively identify high-risk locations—especially where right-turning vehicles interacted with cyclists—and evaluate the effectiveness of the new bike lane design.


Miovision’s Turning Movement Counts captured 24-hour, multimodal traffic data at key intersections, providing detailed insights into travel patterns and volume trends before and after implementation.


The Results: Measurable Improvements From the Phase 1 Pilot

The first phase of the Holly Street pilot delivered clear, data-backed outcomes:

  • 33% increase in bicycle ridership along the corridor
  • 87% bike lane utilization rate, indicating strong cyclist adoption
  • Enhanced pedestrian safety following corridor improvements
  • Identification of right-hook conflict hot spots using near-miss analysis
  • Data-informed design adjustments to improve cyclist visibility and safety


These insights allowed the city to move beyond assumptions and make targeted, evidence-based improvements to the corridor.


“The data we have been able to collect has allowed us to study portions of our road network that were not previously available and has allowed us to better understand the needs of our city streets, develop targeted low-cost solutions, and inform our planning team for future improvements.”
– Shane Sullivan, City Transportation Engineer, City of Bellingham, WA


Who Should Read This Case Study

  • Transportation & Traffic Engineers
  • City Planners & Public Works Teams
  • Vision Zero & Active Transportation Leaders
  • Municipal Decision-Makers evaluating bike lane pilots


See how data-driven insights can improve bike lane safety in your city. Fill out the form to download the full case study now!

Download the Case Study

    Event

    Recap of ITS America Conference & Expo - Phoenix

    X